A scoreboard graphic is the persistent on-screen scoreboard that carries the score and the game state through a live sports broadcast, and the same graphic is called a scorebug: two names, one thing. It sits in a top or bottom corner of the frame, it stays visible for almost the whole match, and it is the graphic a viewer looks at more than any other. Historically the scoreboard was the board in the venue and the scorebug was the small corner version on screen; streaming collapsed the difference. Broadcasters also call it the score bug, the scoreline, the score strap or, in streaming tools, the scoreboard overlay.
It sounds simple. Two team names, two numbers, a clock. It is not simple, and the reason is the thing almost every generic overlay tool gets wrong: a scoreboard graphic is a live model of the rules of a specific sport. A futsal scoreboard that cannot count accumulated fouls is broken. An Australian rules scoreboard that shows a single total instead of goals, behinds and total is wrong. A volleyball scorebug built around a clock is built around something volleyball does not have.
What a scoreboard graphic actually shows
Strip out the sport-specific parts and every scoreboard graphic in world broadcast carries the same four jobs.
| Element | What it answers for the viewer | Where the data comes from |
|---|---|---|
| Team identity | Who is playing, and which one is which | Club record: short name, abbreviation, crest, playing colours |
| Score | Who is winning, and by how much | Live match events |
| Period and clock | How far through the match we are | Match clock, period state |
| Game state | What is about to happen | Sport-specific: tackle count, shot clock, outs, accumulated fouls, player counts |
| Competition branding | What am I watching | Competition or broadcaster asset |
A viewer who joins a stream late reads the scoreboard and knows within one second whether to keep watching. That is the entire commercial case for getting it right. A stream without a scoreboard graphic is footage. A stream with one is a broadcast.
Why the colours matter more than people expect
The blocks of colour either side of the score are not decoration. They are how a neutral viewer tells the teams apart, and they need to match the strip being worn, not the club brand guide. A club whose brand colour is navy but who are playing in a yellow away kit needs a yellow block on the bug that day. This is standard on every top-tier football broadcast and it is one of the most common complaints in grassroots and semi-professional streams, where the graphic pulls a fixed brand colour and the viewer cannot work out who is who.
The fix is to treat playing colours as a separate, per-fixture field from brand colours. Font colour, by contrast, should generally not follow the club palette at all. Fixed, high-contrast type is more readable and removes the risk of a colour clash rendering the score illegible at streaming bitrates.
Why one scoreboard template cannot serve every sport
Most overlay products solve the scoreboard once and then re-skin it. That works until the sport stops behaving like football. One scoreboard template cannot serve every sport because there are four independent models underneath a scoreboard graphic, and each sport picks a different combination.
1. The clock model
There are at least five, and they are not interchangeable.
- Count up, runs continuously - football, rugby league. The clock never really stops, so stoppage time is signalled rather than subtracted.
- Count down, stops on every whistle - basketball, ice hockey, American football. The clock is a resource both teams manage.
- Count up with time on - Australian rules. The quarter has no fixed end time; stoppages extend it, and the umpire decides when it is over.
- Effective time - futsal. The clock stops on every dead ball, so twenty minutes of clock is well over half an hour of wall time.
- No clock at all - volleyball, tennis, baseball in its traditional form. The score itself measures the progress of the match.
A graphic built around a countdown cannot express time on. A graphic built around a clock cannot express a tennis set. This is not a styling difference, it is a different data structure.
2. The score model
An integer per team covers football, basketball and hockey. It does not cover:
- Australian rules - goals, behinds and a derived total, displayed as 8.12 = 60. Three numbers, one of them calculated.
- Tennis - a nested hierarchy. Points inside games inside sets inside a match, with 15/30/40/AD as labels rather than values.
- Volleyball - two scores at once. Points in the current set, and sets won in the match.
- Netball under Super Shot rules - the value of a goal changes depending on where the shot was taken and how much of the quarter is left.
- Rugby codes - different point values per scoring type, and the values differ between league and union.
3. The player-count model
Some sports punish by removing players, and the scoreboard has to say so. Football shows a red card and a ten-man indicator. Ice hockey shows strength: 5v5, 5v4, 5v3, and 6v5 when the goalie is pulled. Handball can run three separate two-minute suspension clocks per team simultaneously, each tied to a named player, while the match clock keeps running. Water polo excludes players for twenty seconds at a time, constantly, so short exclusion clocks run alongside a thirty-second shot clock and an eight-minute period clock. Field hockey has three card colours with three different consequences.
4. The possession model
Rugby league and touch football count tackles or touches, one to six, and that count is the most important number on the screen after the score. American football carries down and distance plus field position. Volleyball carries the serve. Basketball carries a possession arrow. Netball carries the centre pass, which alternates on every goal regardless of who scored.
Scoreboard extensions: the graphic as a statistics surface
A scoreboard graphic is a permanent piece of screen real estate that the viewer is already looking at. That makes it the cheapest place in a broadcast to put more information, and it is why broadcast graphics packages grew extensions - pop-out panels that attach to the scorebug, show a statistic, and retract.
Typical extensions by family:
- Live counters - possession percentage, shots on target, corners, fouls, penalty corners, shots on goal, tackle counts
- Event detail - goal scorer and minute, card and player name, substitution in and out, pitching change
- State panels - shootout trackers, timeout dots, challenge counts, aggregate score across two legs
- Context - other live scores, league position implications, milestone alerts
Two rules make extensions work rather than annoy. First, they should not interrupt. An extension that slides out of the existing scoreboard keeps the viewer in the game; a full-frame stat card takes them out of it. Second, frequency has to be controlled. Firing a stat after every single event becomes irritating fast, which is why milestone-based triggers - every third corner, every fifth foul - beat event-based ones.
Extensions are also the natural home for sponsorship. A stat panel with a sponsor lockup is inventory that did not exist before, it appears at a moment the viewer is already reading the screen, and it does not cost a break.
Where scoreboard data comes from, and why that is the whole problem
At the top of the sport, a scoreboard graphic is driven by an official data feed. Sportradar, Opta and Stats Perform, Genius Sports and others sell live event data, the graphics subscribe to it, and the bug updates without a human touching it. That is how a tier-one broadcast works and it has been solved for years.
Below that tier, the feed does not exist. There is no commercial data provider covering a state league, a college conference, a schools competition or a second-tier domestic season in most sports. So the graphics either sit static, or somebody types into them by hand while the match is going on, which is exactly where errors come from.
LIGR's answer is to make the scoring app the feed. Somebody courtside or in the stand scores the match in the LiveScore app - the same job a scorer or team manager was already doing - by pressing buttons for real events: kick off, goal, card, substitution, timeout, tackle, exclusion. The graphics are subscribed to those events, so the scoreboard updates in real time from the source. Nobody types into a graphic. And because every event is logged with a timestamp, the same actions that drove the scoreboard also produce the match statistics, the extension triggers and the clip markers for automated highlights.
That is why the scoring app has to model each sport properly, and why a shallow one holds the whole graphics package back. If the app cannot record a green card, the scoreboard cannot show a green card sin bin, no matter how good the design is. The list of what each sport needs the app to capture - every clock state, scoring event, card, suspension and persistent element - is the spine of each sport article linked below.
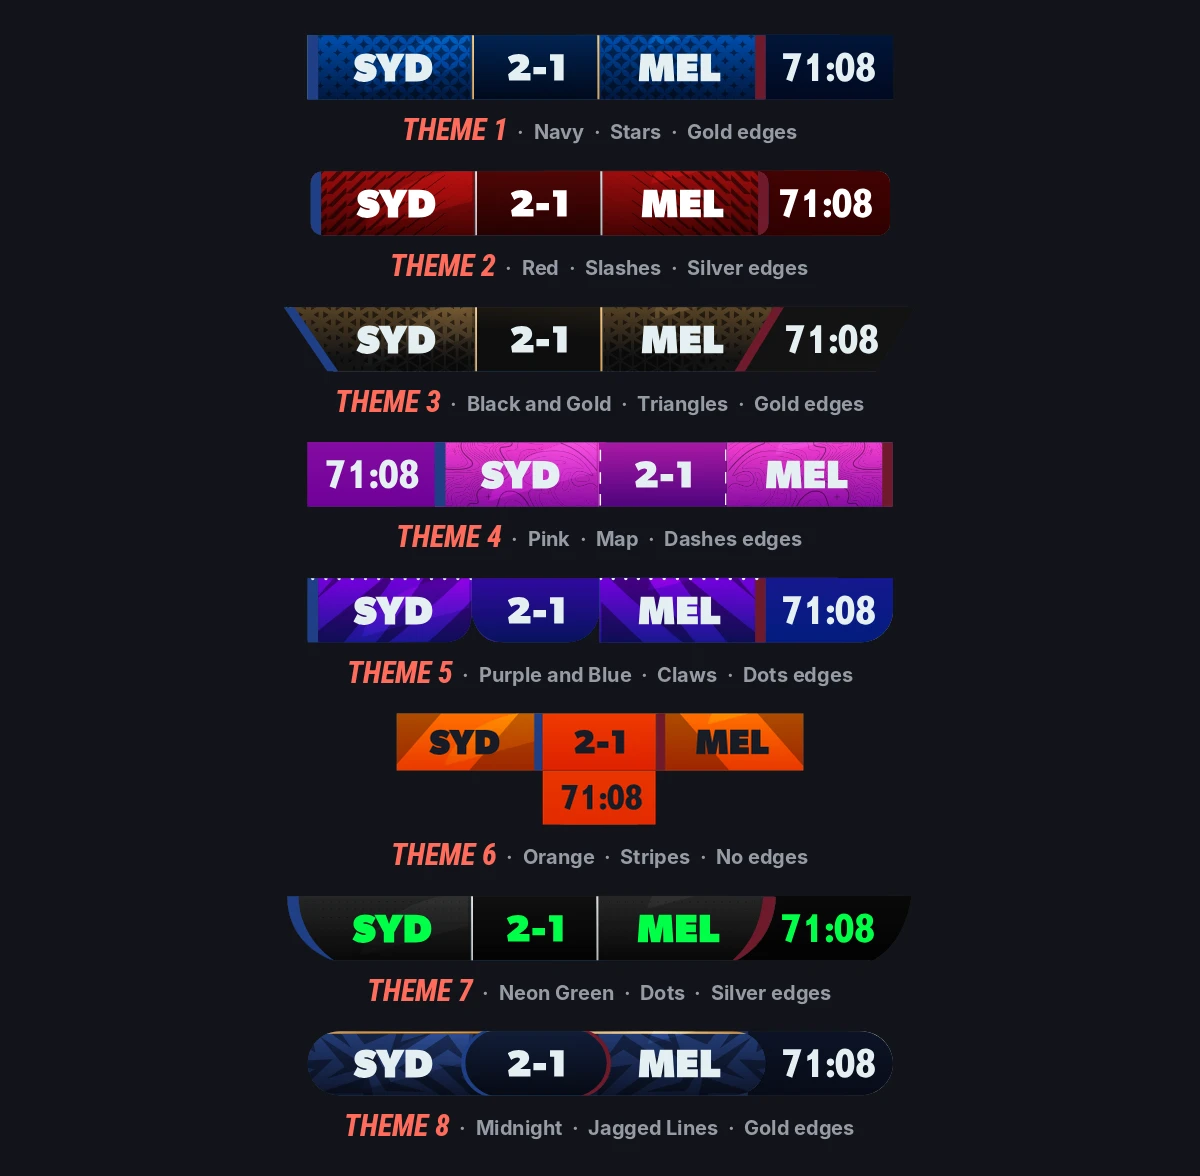
Design: how eight themes become thousands of graphics packages
The other half of the multi-sport problem is visual. Every competition wants a package that looks like theirs, and commissioning bespoke sports broadcast graphics per competition is slow and expensive - historically weeks of designer time and a five-figure bill before a single match goes to air.
The way out is a design system rather than a set of files. LIGR's generic theme library is built as a set of base themes, each exposing configurable variables - primary and secondary colour, accent, typography treatment, corner and edge geometry, motion style, logo placement, bug position and density. Because those variables combine, a handful of themes do not produce a handful of looks. They produce thousands of distinct, legitimate graphics packages, any one of which a competition can adopt in an afternoon rather than a quarter.
Underneath, the animation is authored in Rive and configured in FUSE, LIGR's graphics configuration and publishing engine. FUSE is where a Rive design gets bound to live match data and published to air without a developer touching it. That binding is the reason the same theme can serve a sport with a tackle count and a sport with a shot clock: the elements are variables on the graphic, not shapes redrawn for each code.
Automation: the scoreboard should run itself
Once the graphic is bound to data, the next question is who triggers it. In a traditional gallery, a graphics operator watches the match and fires overlays by hand. That does not scale past a handful of concurrent matches and it is the largest per-match cost in the chain.
Game Plans replace the operator with a rule set. A goal event fires the goal graphic and updates the score. Half time fires the half-time state and starts a break playlist. Every third corner fires a corner extension. A sponsor rotation runs on the clock. The sequence is configured once and then runs for every match in the season. Where a producer does want a human in the loop - a studio show, a cup final, a rundown with talent - the Control Room gives manual control over the same graphics, from a browser.
This is the model behind volume production. DAZN's National League coverage runs 650+ matches a season through automated overlays. LIGR runs the same pattern for Australian rules with the AFL and SANFL, for tennis across the WTA Tour and ITF World Tennis Tour, and for football with Football Australia and the Corsican football league.
Every sport, one scoreboard at a time
Sports scoreboard graphics only look interchangeable from a distance. The rest of this series takes each sport in turn and documents what its scoreboard has to do: the clock states, the scoring events, the cards and suspensions, the persistent elements, and the situational overlays that only that code needs. If you produce one of these sports, the relevant article is a specification you can hold a graphics supplier to.
What to ask a scoreboard graphics supplier
If you are evaluating scoreboard software or a broadcast graphics platform for a competition, these are the questions that separate a real multi-sport system from a re-skinned template.
- Show me the clock behaviour for my sport, not a generic countdown. Can it do time on, effective time, or no clock at all?
- How does the score field handle my sport's format? Ask an Australian rules or tennis question specifically.
- Can the scoreboard show a live player count when someone is suspended, and can it run more than one suspension clock at once?
- What happens when there is no data feed? If the answer is "someone types it in", the error rate is yours.
- Who fires the graphics on match day, and what does that cost per match across a season?
- How long does a new competition theme take, and what does it cost?
- Can I put a sponsor on the bug and report the exposure back to them?
Every function, live
The extensions above are the states this scorebug carries. Each fires from a single data change.
Frequently asked questions
What are scoreboard graphics?
Scoreboard graphics are the on-screen elements that carry the score and game state through a live sports broadcast. The persistent one in the corner of the frame is the scorebug, also called a scoreboard overlay, and the same family covers full-frame scoreboards and the stat panels that attach to them. Whatever the sport, they must show both team identities, the score, the period, the clock where one exists, and the state that decides what happens next.
What is a scorebug?
A scorebug is the persistent on-screen graphic in a live sports broadcast that shows the score, the period and the clock. It normally sits in a corner of the frame and stays visible for most of the match. It is also called a score bug, a scoreline, a score strap or a scoreboard overlay. Its job is to let a viewer understand the state of the game within a second of looking at it.
Why is it called a scorebug?
The term comes from American television, where a small persistent graphic in the corner of the screen was known as a bug, in the same sense as a network logo bug. When broadcasters began leaving the score on screen permanently in the 1990s rather than cutting to a full-frame scoreboard, the graphic inherited the name and became the scorebug.
What information should a scoreboard graphic display?
At minimum: both team identities with distinguishable colours, the score, the period, and the clock where the sport has one. Beyond that it must carry whatever state determines what happens next in that specific sport, such as the tackle count in rugby league, the shot clock in basketball, accumulated fouls in futsal, or the count and outs in baseball. Competition branding usually sits alongside it.
Do I need a data feed to run an automated scoreboard?
No. An official data feed is the easiest path where one exists, but most competitions below the top tier have no feed available. A live scoring app can take its place: an operator records real match events as they happen, and the graphics update from those events. The graphic behaves identically either way, which is what lets one package serve a whole competition pyramid.
What is a scorebug extension?
An extension is a panel that attaches to the scorebug to show additional information, then retracts. Typical extensions show possession, shots, corners, fouls, a scorer name, a substitution or a shootout tracker. They can be triggered automatically at milestones or fired manually from a control room, and they are a common place to carry sponsor branding without interrupting play.
Can one scoreboard template work for every sport?
A single visual style can, but a single template cannot. Sports differ in four independent ways: how the clock behaves, how the score is structured, whether players can be removed temporarily, and how possession is tracked. A genuinely multi-sport system binds those to data as variables, so the same theme can render a tackle count for rugby league and a shot clock for basketball.
How much does a custom scorebug cost?
Commissioning a bespoke broadcast graphics package traditionally means weeks of designer and developer time and a substantial one-off build cost per competition. A configurable theme library changes the economics: a competition picks a base theme and sets its own colours, type, motion and layout, which brings a branded package within reach of organisations that could never fund a bespoke build.
Do I need an operator to run a scoreboard during a match?
Not for the graphics themselves. If the scoreboard is driven by match data, automation rules can fire every graphic in the package from events and the clock, with no operator watching the match. A human is still worth having for a studio show or a cup final, where a producer wants control over a rundown, and a control room gives them that from a browser.
See it running on your sport
LIGR runs automated sports broadcast graphics across football, tennis, Australian rules, basketball and more, from official data feeds or from a live scoring app where no feed exists.