Broadcast graphics software for live sport
LIGR is cloud-native sports broadcast graphics software. It binds real match data to animated overlays and puts them on air automatically, across every fixture in a competition, with no graphics hardware and no operator behind a switcher for each match.
What live broadcast graphics software actually has to do
Most products sold as broadcast graphics are overlay renderers. They draw a shape on top of a video signal and leave the hard part to you. Sport is unforgiving about the hard part, because a graphic that is late, wrong or stale is worse than no graphic at all.
Built for leagues, federations, clubs, broadcasters, production companies and schools producing live sport at volume. The graphics are driven by the game, not by a person watching it.
Data binding
Every element on screen has to read from a live source rather than from a person typing. Team names, colours, crests, squad numbers, scores, possession, cards, substitutions and season statistics all arrive as data and land in the right slot. One template then covers a whole competition instead of one fixture.
Clock and event handling
Clocks count up, count down, stop, restart and roll into extra time. Periods, quarters, halves, sin bins, timeouts and stoppages all change what the score bug is allowed to show. Broadcast graphics software has to model the clock of the sport, not simply print a number that somebody remembered to update.
Per-sport logic
Tennis scores in games, sets and tie breaks. AFL scores in goals, behinds and a running total. Rugby league needs a set count. Cricket needs overs and wickets. Generic sports graphics software that treats every code as home versus away plus two integers will be wrong on air within minutes.
Theming and design control
One design system, many competitions. Colours, typography, crests, corner radii and sponsor slots swap per club, per round or per broadcaster without anyone redrawing the artwork. A broadcast graphics package is only reusable if the look is a variable rather than something baked into the file.
Automation rules
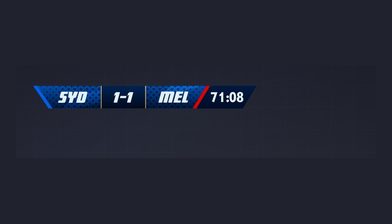
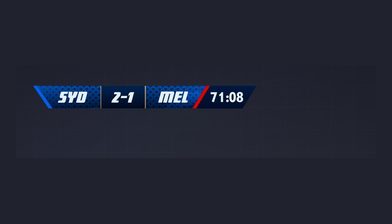
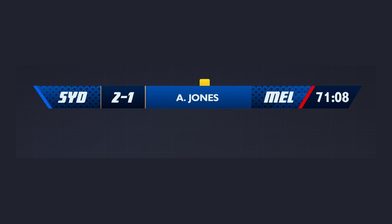
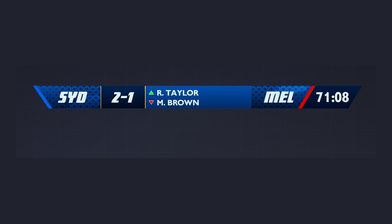
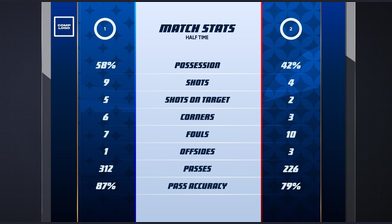
A goal should trigger a scorer bug. A card should trigger a lower third. Half time should trigger a stats panel and a sponsor board. Rules that watch the match feed and fire graphics are the difference between software that assists an operator and software that replaces the need for one.
Sponsor rotation and reporting
Sponsors are why most of this gets funded. The software needs timed and event-triggered sponsor slots, a rotation order that does not repeat awkwardly, and a log of what was shown and for how long, so the rights holder can report exposure back to the sponsor after the match.
Multi-feed output
The same match often needs several different outputs at once: a horizontal OTT feed, a vertical social cut, an in-venue big screen and a clean feed for a broadcast partner. Each one wants different graphics, different safe areas and sometimes different sponsors from the same underlying data.
Protocol support
Live broadcast graphics software has to accept the signal you actually have. That means SRT and RTMP contribution, NDI on a local network, and direct ingest from automated cameras such as Veo, Pixellot, Spiideo and Hudl Focus, then push finished output to the destinations you publish on.
Manual override
Automation carries the routine work, but live sport produces situations nobody wrote a rule for. There has to be a browser-based control surface where a human can correct a score, hold a graphic, force a replay bug or take a sponsor down, without stopping the broadcast to do it.
The single most-used element, the score bug, is written up sport by sport in the guide to sports scoreboard graphics. The full capability breakdown of the platform sits on the products page.
Cloud, hardware or overlay tool
There are three categories in this market, and they are good at different things. We sell one of them, so read the table knowing that, and note where we lose.
| Cloud, software-defined | Hardware graphics systems | Template overlay tools | |
|---|---|---|---|
| Upfront cost | None. Browser and an internet connection. | Significant capital purchase per system. | Low or free. |
| Cost per additional venue | No new system required. | A further system per venue or a truck visit. | No new system required. |
| Operators per broadcast | Zero to one, depending on how much is automated. | Usually a dedicated graphics operator. | One person driving it manually throughout. |
| Glass to glass latency | Seconds, set by contribution and delivery. | Sub-500ms and frame accurate. | Seconds, set by the encoder. |
| Native SDI | No. IP contribution and delivery. | Yes, built for baseband plants. | No. |
| Live data binding | Core function. Graphics read from match data. | Available, usually through a bespoke integration. | Manual entry or a simple spreadsheet link. |
| Per-sport scoring logic | Built in across codes. | Built for the sports the plant was configured for. | Rarely more than score and clock. |
| Sponsor rotation and exposure logs | Built in and reportable. | Possible, often bolted on. | Manual. |
| Complex real-time 3D and AR | Limited to 2D and motion design. | Best in class. Tracked AR, virtual sets, ball tracking. | No. |
| Concurrent matches | Scales horizontally. Many fixtures at once. | Bounded by systems and staff available. | One per operator. |
| Best suited to | Leagues and federations producing volume across many venues. | Tier one events where latency and AR justify the cost. | One-off streams and hobby production. |
Where hardware wins
Sub-500ms glass to glass latency, frame-accurate keying and native SDI are real advantages of a hardware graphics system, and no cloud product should pretend otherwise. If your graphics have to sit inside a baseband plant, drive an in-venue screen in step with play, or carry tracked augmented reality and virtual sets, buy the hardware. That is what it is for.
Where software-defined wins
Volume. When the requirement is every match in a competition rather than one match on a Sunday, the constraint stops being render quality and becomes systems, trucks and people. Cloud broadcast graphics software removes all three from the per-match equation and lets one design system cover an entire season.
The long-form version of this argument is in cloud versus hardware broadcast graphics, and there are direct comparisons against Singular.live, Ross Video and a traditional production truck.
Why the cost model is different
The interesting change is not the price. It is the shape of the cost, and which numbers it multiplies by.
No hardware to buy or depreciate
There is no graphics system to specify, purchase, rack, insure, maintain or replace on a refresh cycle. The capital line disappears and with it the pressure to sweat an asset for seven years while the design language moves on without you.
No per-venue systems
In a hardware model, covering a second ground means a second system or a truck movement. In a software-defined model the venue needs a camera and a connection. Your cost stops scaling with the number of grounds in the competition.
No operator per broadcast
The largest recurring line in traditional sports broadcast graphics is people, and it multiplies by every fixture. Automation moves that work into rules configured once, so the crew requirement per match falls to a scorer, or to nobody.
Design cost is paid once
Templates are built against data rather than against a fixture. The design investment happens once per competition and then serves every match in it, rather than being re-cut for each broadcast.
The net effect is that cost tracks the number of matches you produce, not the number of venues you have equipped or the number of shifts you have rostered. Plans are on the pricing page, and there is a calculator for modelling it against your own fixture list.
How LIGR builds a sports graphics package
Five parts, each doing one job. Together they are what turns a set of designs into sports broadcast software that runs a season without you.
See the out-of-the-box themes across eleven sportsRive
The animation framework the designs are authored in. Real vector animation with state machines, so a score bug can transition between states rather than cutting between images. Designers work in a tool built for motion, and the output is a live asset rather than a rendered video file.
See RiveFUSE
The graphics configuration and publishing engine. FUSE binds Rive designs to live data fields, sets theming per competition and club, and publishes the finished package to production. No code, and no rebuild when a sponsor changes or a club updates its crest.
See FUSELiveScore App
The sport-specific scoring app. The operator presses real match-event buttons, a goal, a card, a substitution, and the graphics follow. Every event is timestamped, which is what makes stat extensions and automated highlight generation possible from the same input.
See LiveScore AppGame Plans
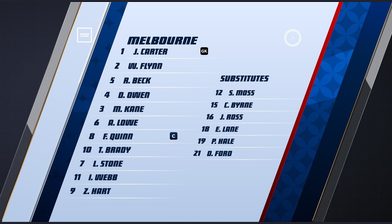
The automation layer. Rules that fire graphics from match events or from the clock: line-ups before kick-off, a scorer bug on a goal, stats at the interval, sponsor boards on rotation. Configure once per competition and it applies to every fixture in it.
See Game PlansControl Room
The browser-based control surface. Take manual command of any graphic, correct a score, hold a lower third or drop a sponsor, live, without interrupting the broadcast. Automation handles the routine, and Control Room handles the day football decides to be football.
See Control RoomFeeds arrive over SRT, RTMP or NDI, including directly from AI cameras such as Veo, Pixellot, Spiideo and Hudl Focus. Output goes to OTT, social and broadcast destinations at the same time. That whole chain is described on the cloud production page.
Running at competition scale
Volume is the test. Any graphics system can look good for one showcase match. These are competitions where the software has to be right every week.
DAZN and the National League
More than 640 matches per season of English National League football produced with LIGR graphics, across grounds with very different production capability.
AFL and SANFL
Australian rules football, a code with scoring and clock behaviour that generic sports graphics software consistently gets wrong.
WTA Tour and ITF World Tennis Tour
Tennis scoring in games, sets and tie breaks, across tour events with their own brand requirements.
Queensland Rugby League
Rugby league across a state-wide competition, with set counts, sin bins and a clock that behaves unlike any of the above.
Football Australia
Football Australia runs LIGR across 4,000+ live matches annually, spanning nine State Member Federations.
And more
Basketball NSW, Cricket Tasmania, the EuroMillions Basketball League in Belgium, Horizon League, World Sevens Football in Miami and the Corsican football league.
Who it is for
Leagues and federations
Hundreds or thousands of fixtures a season across venues you do not control. You need one broadcast graphics package that every club can produce against, with the competition brand intact whether the match is a grand final or a Tuesday night reserve grade game.
See the detailClubs
A single ground, a fixed camera and a small crew. The value is a broadcast that looks like the league it belongs to, with sponsor slots that can actually be sold, without hiring a graphics operator for every home game.
See the detailBroadcasters and OTT platforms
You are taking feeds from many sources and need consistent sports broadcast graphics on all of them. Data-driven templates plus per-feed theming mean a common look across rights that were never produced to a common standard.
See the detailProduction companies
You produce for several clients with different brands and different sports. Reusable templates, per-client theming and automation reduce the crew you have to send, which is usually the number that decides whether a job is worth taking.
See the detailSchools and colleges
Students run the broadcast. The software has to be usable by someone who learned it last week and still produce something a parent watching from another state would call a proper broadcast.
See the detailProfessional and elite programmes
Performance and media teams that want match footage, timestamped events and broadcast output from the same operation, so the highlights, the analysis clips and the live stream all come out of one pass.
See the detailQuestions
Broadcast graphics software renders the on-screen elements of a live video production: score bugs, lower thirds, line-ups, statistics panels, sponsor boards and full-frame transitions. In sport it also connects those elements to live match data so the score, clock and player names update from the game rather than from someone typing. It can run on dedicated hardware or, increasingly, in the cloud.
Put your next match on air
Tell us about your competition and we’ll show you how it looks with LIGR.