Technical guide · Data and automation
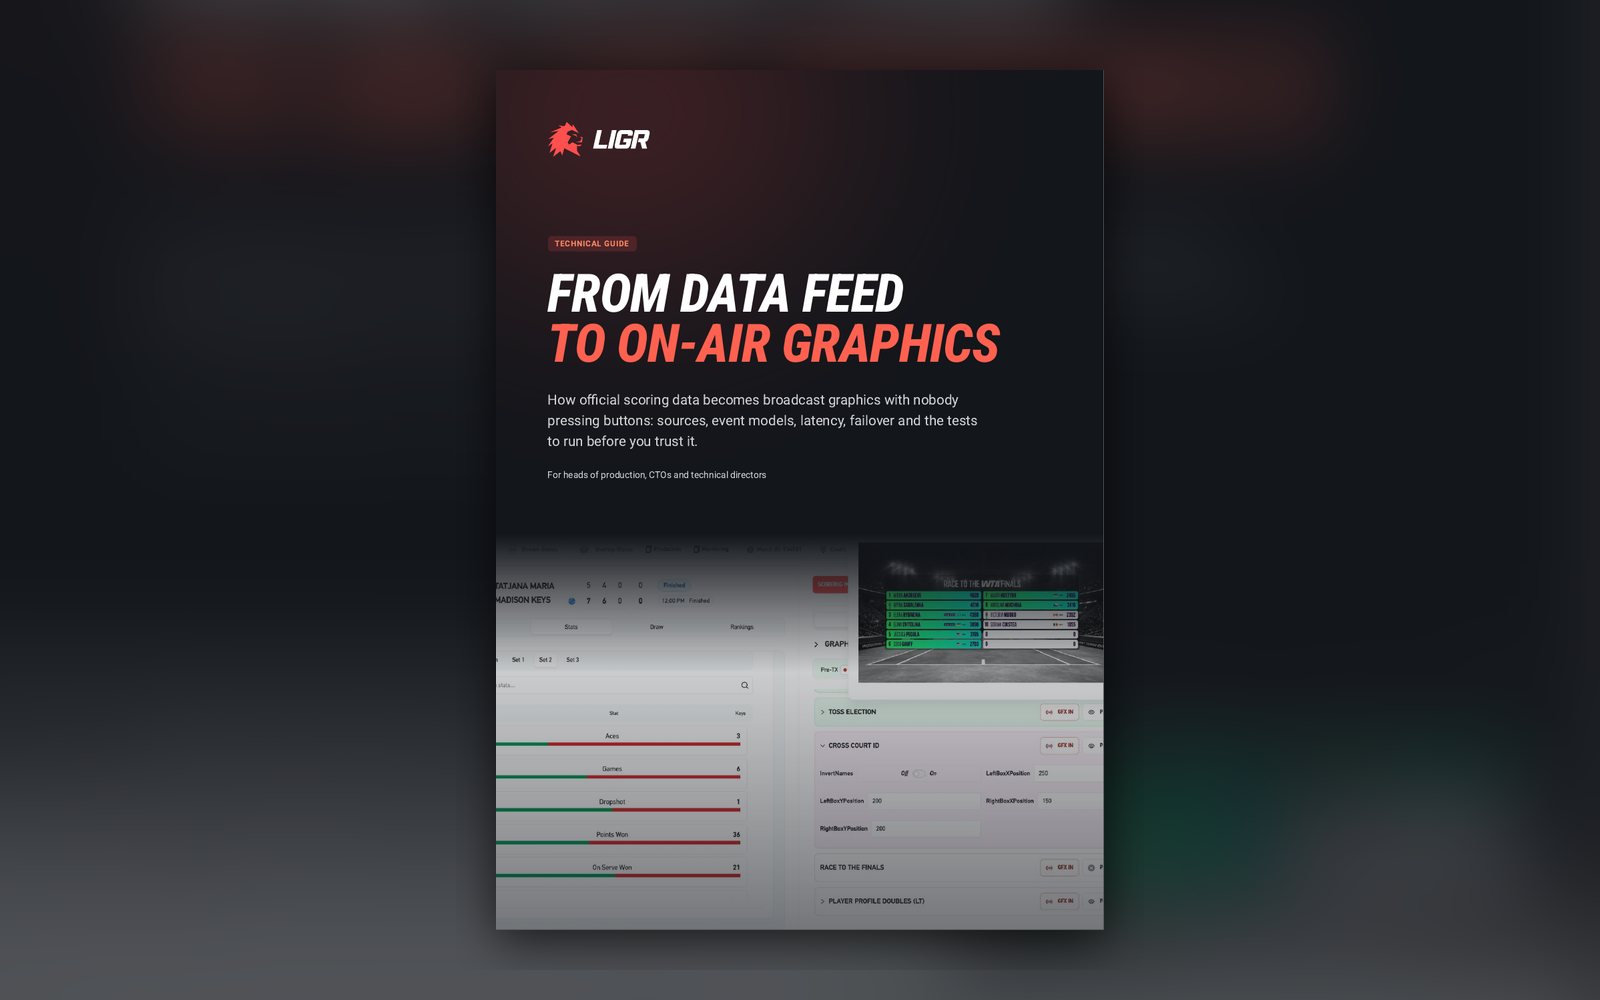
From data feed to on-air graphics
How official scoring data becomes broadcast graphics with nobody pressing buttons: sources, event models, latency, failover and the fifteen tests to run before a season.
Get the guide
Instant access, no cost. What you get:
- The guide (PDF)
What's inside
Inside the guide
01
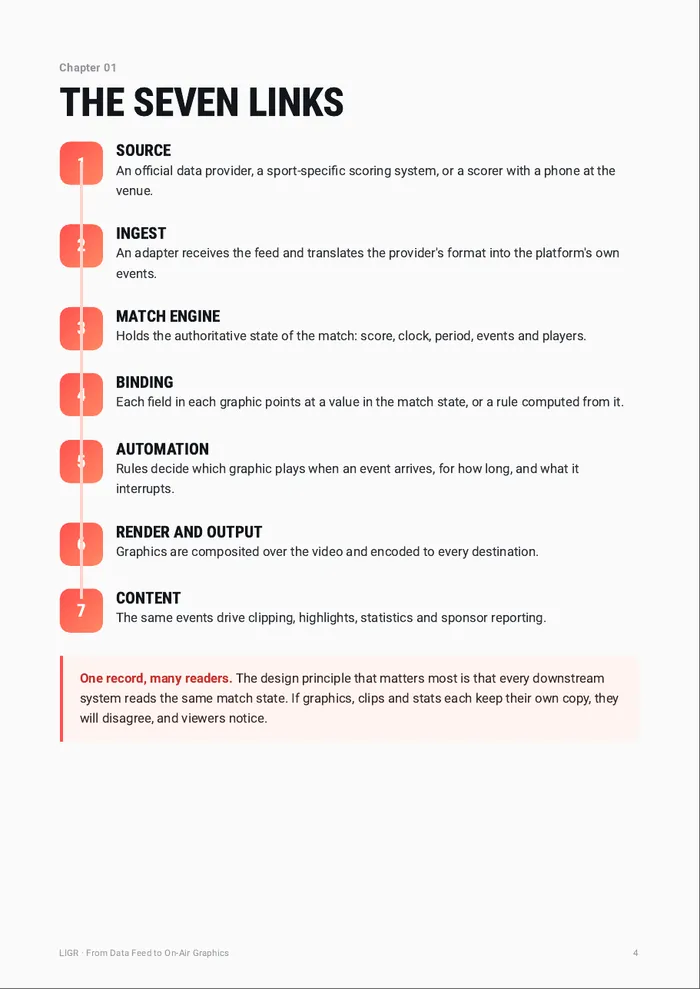
The seven links
Source, ingest, match engine, binding, automation, render and content, and what can go wrong at each.
02
Where the data comes from
Official providers, sport-specific scoring systems and scorers at the venue, and how to combine them.
03
The event model
Events versus state, and five rules that make every downstream system agree.
04
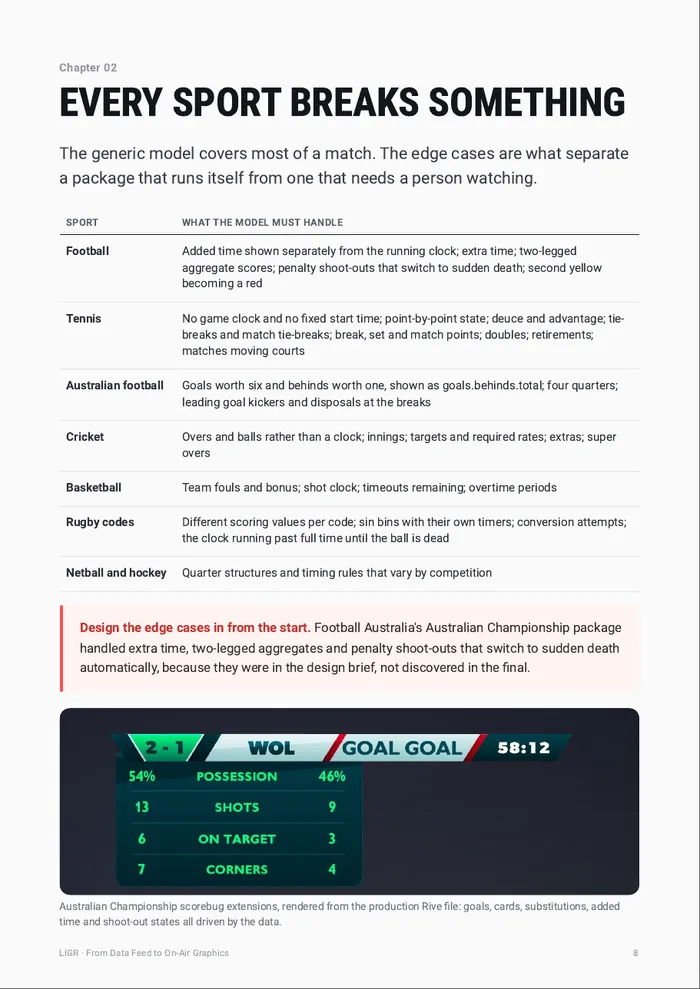
Every sport breaks something
The edge cases in football, tennis, Australian football, cricket, basketball and the rugby codes.
05
Latency and the spoiler problem
Where delay comes from, and why graphics must stay in step with the pictures, not just be fast.
06
Fifteen tests and a go-live checklist
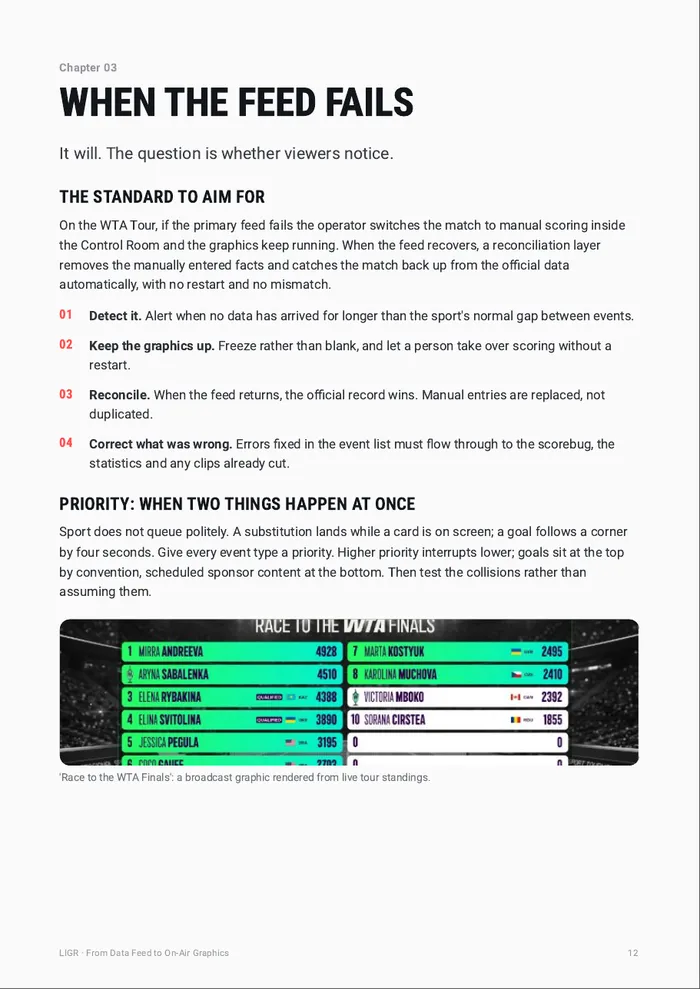
Rehearse every failure on a recorded match before the season does it for you.
A look at the pages
Swipe for more pages
Written for
- Heads of production and technical directors
- CTOs evaluating automated production
- Data and integration teams
Put it to work
Score your production readiness
Questions
Is this specific to LIGR?+
Mostly not. The chain, the event model, the latency budget and the tests apply to any data-driven graphics system. Where we describe LIGR, we say so and use published examples.
Which data providers does it cover?+
It covers the types of source: official providers such as Genius Sports, Sportradar, Stats Perform, Opta and Champion Data, sport-specific scoring systems, and scorers at the venue.